

By Mike Dane
Understanding where exactly your respondents click and spend time on your website is something that every business owner wants to know. Well, conducting a survey could help understand where your site visitors are clicking.
However, not everyone will be accurate in telling you this. Worse still, no one really has the time to keep updating you on their activities on your website.
So, what is the best solution?
Heatmaps!
In this post, we will look at heatmaps and how they can be used to increase conversions. The table of contents below will give you a glimpse of what to expect.
- What is heat mapping or heatmaps?
- Types of heatmaps
- Relationship between heatmaps and conversion
- Why care about conversions?
- How to use heatmaps to increase conversions
What is Heat Mapping or Heatmaps?
Heatmaps are graphical representations of data using colours to indicate the level of activity. Normally, darker colours are used to indicate low activity while brighter colours are used to indicate high activity levels.
The screenshot below gives a technical explanation of heatmaps, as American Statistician describes it:
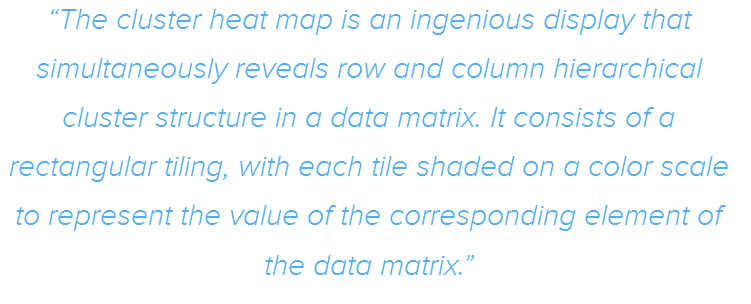
Source: Crazyegg
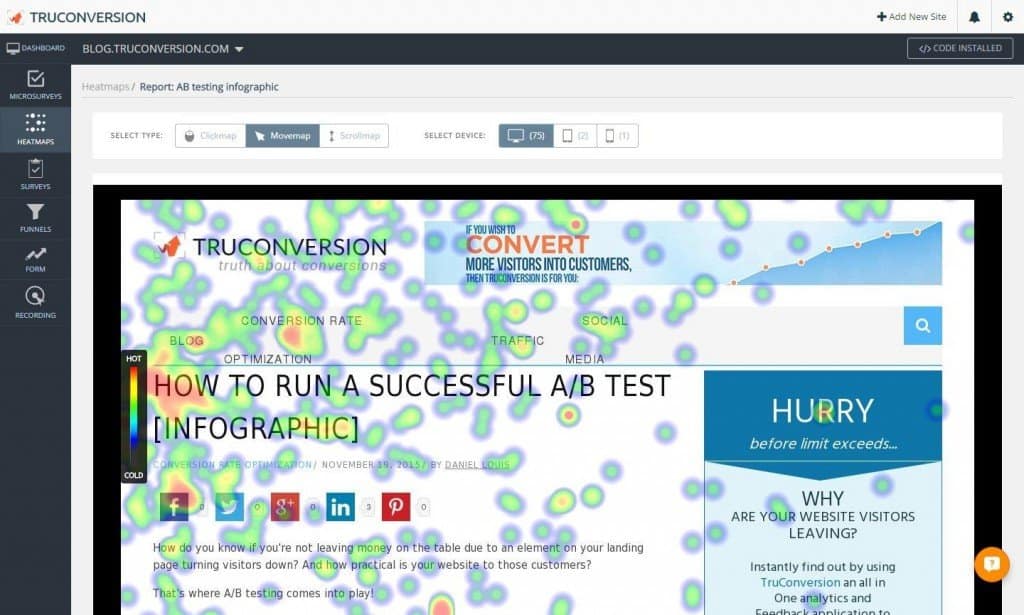
Now, let’s see a screenshot of a heatmap example, before we proceed:
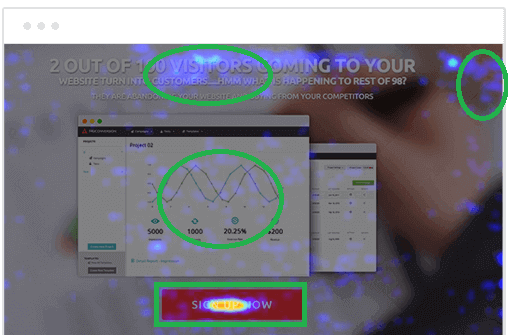
Source: Truconversion
The green circles in the image above show you a visual representation of where mouse pointers have been in this sample website.
Types of Heatmaps
There are different types of heat maps designed to track different types of data and interactions.
In this post, we will briefly mention just three of these.
- Mouse-movement heatmap
This is mainly used to show how users read and navigate through your page. Even better, this tool tells you how many visitors hover over a particular section of the page, helping you point out the most interesting and boring areas.
Here is an example of how this feature looks like:

Source: Christopherjanb
- Clickmap
This is a very great feature especially when you want to track performance of important buttons such as the CTA button.
Clickmap works by showing you where site visitors are clicking, thereby advising on you on what buttons to eliminate especially when they serve as distractions.
- Scroll map
These show the point at which your site visitors abandon a page as they scroll through content.
Other than Google guiding on the length of content, you can also rely on scroll maps to tell you just how much or how little your audience is reading. After which, you can re-strategize on your content length.

Source: Truconversion
As seen, a scroll map will use colour codes to show you sections where your visitors spend the most and the least time.
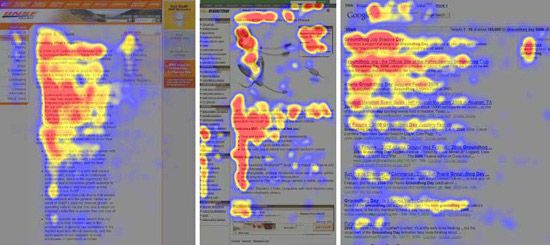
- Eye-tracking heatmap
This is the most expensive type of heatmap due to its complexity. Basically, it works by showing you exactly what your visitors are looking at meaning that you need to use complex technology and expensive software.
See in the example below how eye-tracking heatmaps, are used:
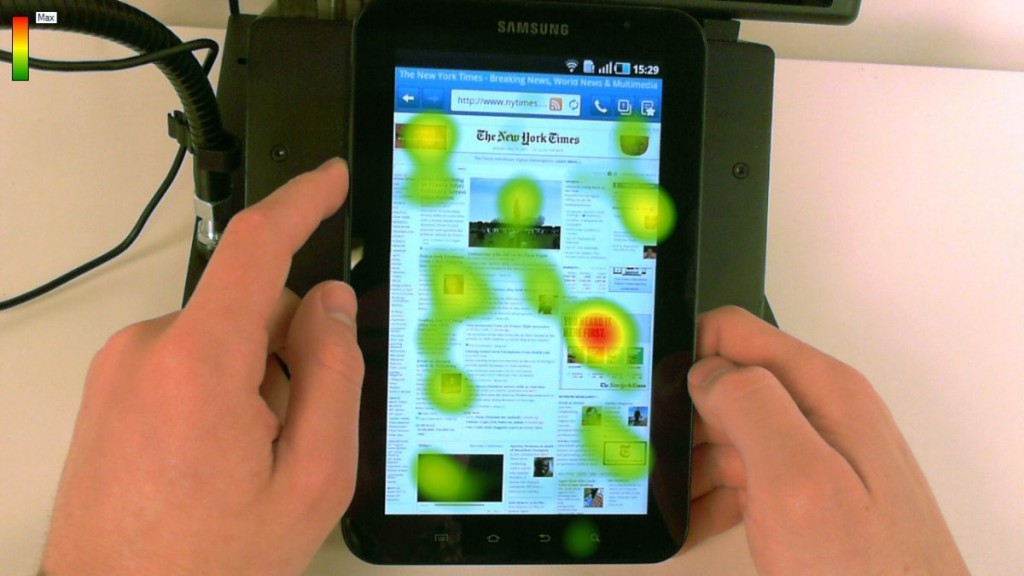
Source: Businessinsider
You can see that images and videos are the most popular kind of content on the New York Times homepage.
So, why the noise on heatmaps and conversions?
Relationship Between Heatmaps And Conversions
To better understand this point, we will use case studies in this subtopic.
The North Face Case Study
In a bid to increase their shopping cart conversion rate, North Face opted to use heatmaps after other tools at their disposal failed.
Using heatmaps, the business was able to discover that many users or site visitors did not pay attention to the checkout button on the shopping cart page. Instead, they were interested in the promotional banner above the checkout button, which invited users to become rewards members.
While the business was achieving ones of its goals- increasing the rewards programs membership, it was losing out on conversions which of course affected sales.
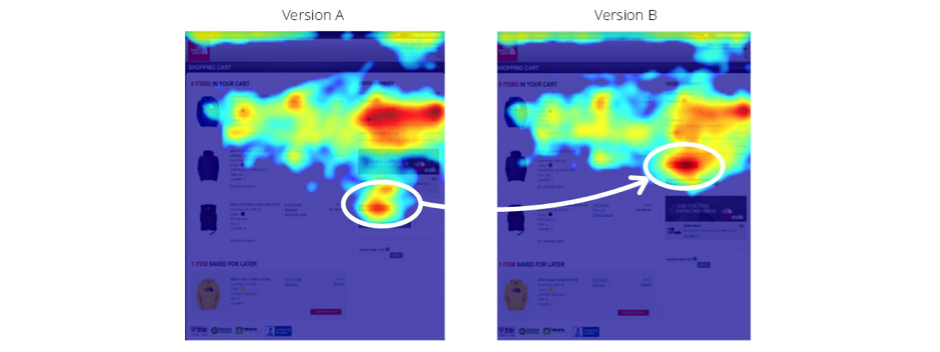
The business used this information to do a/b testing in a bid to find out the best position for the promotional banner without compromising conversion rates.
Of course, heatmaps were used during the test to see the position from which the checkout button was clicked the most.
The business realized through the heatmaps that site visitors clicked the checkout button most when it was placed above the banner.
As a result, heatmaps increased conversions by 21%.
The image below shows the different heatmaps generated during the a/b tests.

Source: Conversionsciences
You can see from the image above that version B had the most clicks.
SoftMedia Case Study
Softmedia wanted to identify problematic areas in their website. By observing heatmaps, the business was able to understand where their customers clicked most and why.
The heatmaps revealed that instead of completing desired tasks, site visitors were getting distracted by other site features such as ‘do not click here’ tabs.
Consequently, the business had to remove the distractions and as a result, was able to increase conversions by 51%.
The image below shows you the heatmaps before and after changes:
Source: Tribes
The ‘do not click here’ button was preventing visitors from clicking on the ‘request a quote’ button. This was removed, leading to a better optimized page.
Why Care About Conversions?
We have used two case studies to show you how heatmaps have helped increase conversions for businesses.
But you ask-why should I care?
All first time site visitors are usually anonymous. When these people navigate your website, they are bound to perform certain actions such as read articles and watch videos and maybe leave.
However, as a business, you use your website to generate leads and make sales. This means that you need to convert these people from just anonymous, into interested known parties that perform your desired tasks.
Therefore, conversion could be when someone signs up for your mailing list, downloads your ebook, makes a purchase or even click-through to other pages.
You should care about people taking these actions and converting for a number of reasons:
- Better ROI
How much have you invested in your website? That amount coupled with advertising could be taking a toll on your pocket.
Of course, with such investments, you expect a high ROI. While the solution could lie in extensive advertising and promotions, you could actually work on optimizing your website to increase on conversions, spending less while you earn more.
It is actually estimated that 50% increase in conversion rate results in 500% increase in sales.

Source: Conversionrateexperts
Other reasons are:
- You get clients for free without spending advertising money
- It gives you a competitive edge in business
How to Use Heatmaps To Increase Conversions
73% of companies have no idea why consumers abandon their shopping carts without buying. To figure out such a problem, 63% of marketers decide to optimize their websites based on intuition and best practices.
The common problem here is conversion, and heatmaps is the solution that these marketers need.
Heatmaps give you extensive qualitative and quantitative data that you can use to improve your conversions. If you are not careful, this data can be overwhelming. It is therefore prudent to be strategic and understand how to use heatmaps.
Here are 4 ways you can use heatmaps:
- Gauge the effectiveness of your CTA
The success of a call-to-action is entirely pegged on the number of people who click on it. If no one clicks on it, then the CTA has a problem.
A heatmap with clickmap functionality will show you exactly where visitors click on your page, going as far as showing the density, in turn helping you gauge the effectiveness of your CTA.
Combining clickmaps and a/b testing will give you quantitative insight on how to improve important CTA elements such as CTA button design, CTA text and button.
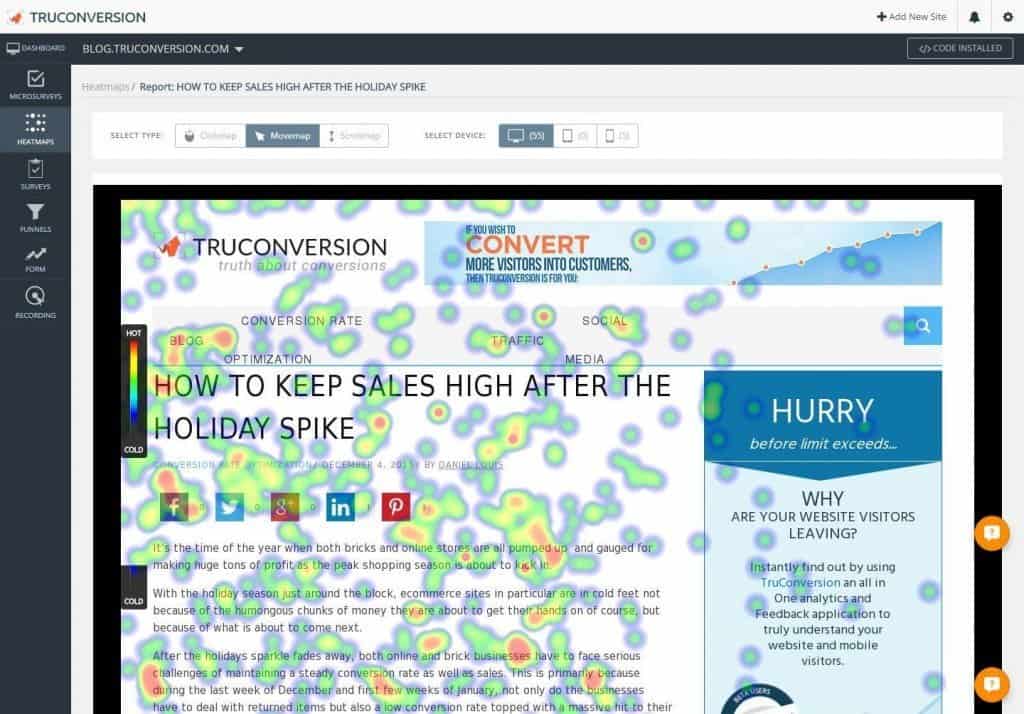
- Understand site visitor’s reaction to content
Sometimes, you do not necessarily want your clients to buy a product. Instead, you want your content read. To gauge how good it is, it is important to know if they read to the bottom of the page and their reading patterns.
To get a better sense of this, you should use the mouse-tracking map in heatmaps, observing where the cursor stops. This gives you insight on the kind of content that is interesting to your readers.
The example below shows us how Truconversion blog uses heatmaps to know how its readers react to content:

Source: Christopherjanb
- Optimize CTA Placement
There is no one-size fits all rule when it comes to placing your CTA button. Truth is, these things are based on the type of clients you have and where they are based. Therefore, for you to optimize better, you need to conduct your own research.
This is exactly what heatmaps will do. They will save you the time spent asking dubious questions to your clients and instead help you observe their browsing patterns. By knowing where they spend their time and hover the mouse, you will optimize placement of your CTA buttons.
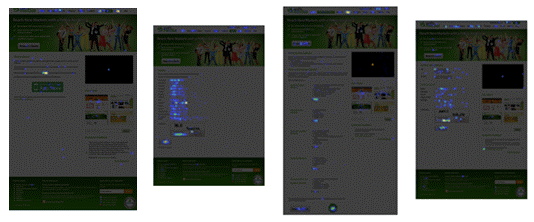
The case study below shows us how heatmaps helped observe that people from English-speaking cultures tend to browse with an F-shaped pattern, giving the illusion that CTAs should be placed on the left side of the screen.
As you can see from the illustration below, the heatmaps clearly shows the side of the page that most users focus on:

Source: Christopherjanb
Let’s see how one business actually used heatmaps to optimize placement of CTA:
Dennis Publishing wanted to find out the side of their page that their visitors focussed more on. After using an eye-tracking heatmap, it emerged that the site visitors paid most attention to the left hand column of the site.
This informed their decision to shift their Google Ad to the left side of the page.
The result:
The click-though rate increased by 44% and Revenue per 1000 ad impressions by 48%.
The image below shows us the pages before and after the heatmap results:

Source: Vwo
From the image above, you can see that the Google Ad was initially located at the bottom of the middle corner. Of course it was later shifted to the left pane, significantly increasing conversions.
- Bring Invisible Issues To light
Even the best of landing pages and websites sometimes suffer from unexpected low conversion rates. When these businesses are sure that they have used the best recommended practices, then they get confused.
Luckily, heatmaps are great at unearthing invisible issues.
Let’s see how truck and trailer breakdown service TruckersAssist used heatmaps to discover why its sharp page design was not converting.
This was the original landing page:

Source: Adespresso
While this landing page design seems perfect to the eye, it still had conversion problems. A heatmap clearly showed what elements were working for the page and which ones weren’t.
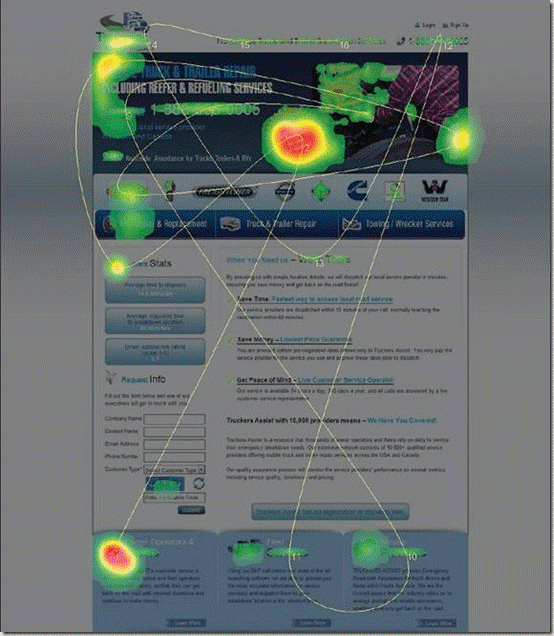
Source: Adespresso
From the image above, it is now obvious why the page was not converting. People were spending their time looking at the ‘no fees’ section which unfortunately was not clickable.
People were also ignoring two avenues for lead generation. The ‘call us’ button at the top of the page and the request for information form at the left middle part of the page.
This information caused the business to develop a new landing page, which ensured that the CTAs were conspicuous enough.
Let’s take a look at the heatmap for the improved landing page:
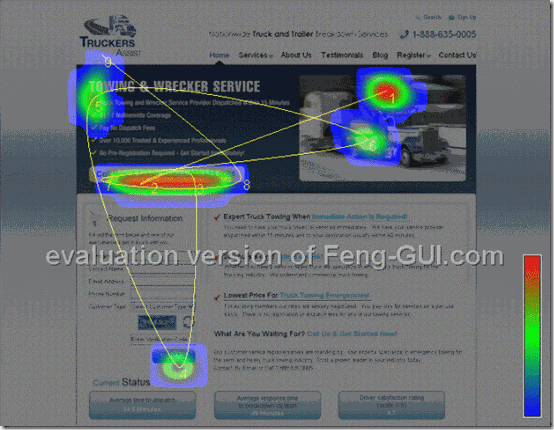
Source: Adespresso
The CTAs were moved to better positions, increasing their visibility.
Final Thoughts
Clearly, heatmaps help uncover what is hidden to your eyes, enabling you to solve a multitude of conversion problems.
To do this, you need to invest in the best heatmaps, which offer extensive analysis and insight.
One such tool is Truconversion, an all-in-one web analytics tool. Its heatmaps features include scroll maps, overlay reports, spectrum reports, mobile heat maps and mouse move map among others.
You could try it today and let us know in the comments section below how it has worked for you, of course including suggestions on how to make it better.
Meta Description
Your conversion problems could be hidden from your physical eye but not heatmaps. Read this post to understand what heatmaps are, the different types and how to use them to improve conversions.
Tweetable Phrases
Combining clickmaps and a/b testing will give you quantitative insight on how to improve important CTA elements such as CTA button design, CTA text and button.
73% of companies have no idea why consumers abandon their shopping carts without buying
Other than Google guiding on the length of content, you can also rely on scroll maps to tell you just how much or how little your audience is reading
It is actually estimated that 50% increase in conversion rate results in 500% increase in sales.
Heatmaps give you extensive qualitative and quantitative data that you can use to improve your conversions
—
Mike Dane is a Digital Marketing professional and currently working as a PR manager at #TruConversion.com He truly loves Online marketing and anything digital. He is very focused about who he works for. Once he starts work, he is fully committed to his duties and responsibilities at that company.
Other Articles

How Your #SME Can Benefit from the Latest SaaS Products
