

Republishing a fabulously insightful blog article from the folks at WarfarePlugins. (original post)
Do you know your top performing social networks? You do now with this complete guide to using Google Analytics for Social Media ROI!
One of the hardest things to measure for most people is the ROI (return on investment) of social media. For bloggers, business owners and digital marketers it can be frustrating to try and determine what is actually working, and how well.
Well at Warfare Plugins we’ve set out to at least make it a little bit easier to track your Social Media ROI through Google Analytics with a custom Google Analytics Dashboard.
To frame this a bit more for you– we’ll be looking at how to track which social networks are performing best for your website or blog. In order to do this you will need at least two things:
- A website or blog (obviously)
- Google Analytics activated on that website or blog
If you have both of those things ready to go, let’s get started…
Getting Started with Google Analytics
In order to track your return on investment for Social Media, you should first familiarize yourself with some basic Google Analytics features.
The specific features I’ll be talking about in this article are:
- Goals: the most important of metrics— also referred to as conversions. These are the actions that drive your business.
- UTM Tracking: a way of tracking links shared on social media.
- Dashboards: a customizable snapshot of your most important metrics. This is where we measure everything that is important to us.
Now let’s break each of these down one-by-one.
Setting Up Goals and Conversions
Goals can be set up in Google analytics to track nearly any website objective or conversion that is considered by you to be a “win”. This can include newsletter sign-ups, contact form submissions, or product sales.
The easiest way to set this up is to create what’s called a destination goal. This is a goal that will track every time a certain page on your site is reached— a “Thank You” page for example.
How to set up a destination goal
For this example we will be creating a typical destination goal. We’re going to attempt to track every time someone signs up for our email newsletter.
First you’ll need to open up Google Analytics and navigate to your account. Then follow this process:
- Click on the Admin tab at the top of the page
- Click on the Goals tab in the 3rd column
- Click the red “+New Goal” button
Now we can begin setting up this goal.
Step 1 is to select the Custom option as opposed to one of the provided templates.

After selecting the Custom option, click the blue Continue button.
Now you’ll need to give your goal a Name. Keep it simple— we’re just going to useSignup for this example.
You could choose to make it super specific if you plan on making multiple goals and having a way to track each goal individually. But for now, let’s just stick with simple.
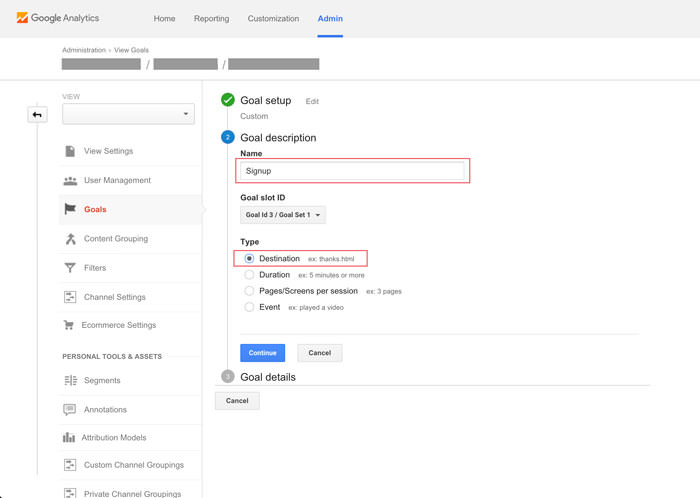
Once you’ve added the Name you now need to select they Type of goal, and as I’ve already said, this will be a Destination goal. Once you’ve selected that option, click the Continue button.
Now on the final step you simply need to add in the URL of your “Thank You” page that people are sent to once they sign up. This is assuming that you’ve set up a redirect to send them to this page when they submit the signup form.
Next to the Equals to box, enter your Thank You page URL and you’re finished.
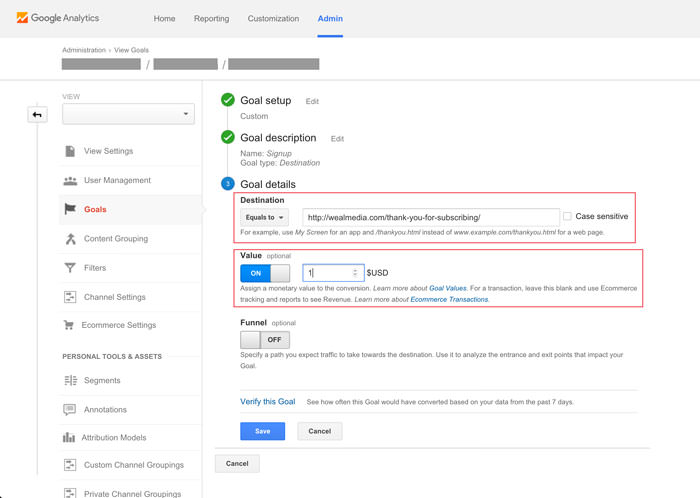
You have the option to assign a monetary value to these goals if you like. What that will do is add up a dollar amount for each time this goal is reached so you can track revenue.
I generally set an email subscriber to a $1 value, just because it gives me something to start with.
In the spirit of keeping things super simple, we’re going to just ignore the Funnel option.
All you need to do now is click the Save button and your goal will begin tracking immediately.
This tutorial on setting up a Google Analytics goal is super easy and helpful!CLICK TO TWEET
UTM Tracking
If you’re not familiar with what UTM tracking is, I wanted to give you a brief overview. This is one of the features we’ve built into our flagship product, Social Warfare and plays a vital role of how we monitor how social sharing is affecting our own inbound traffic.
If you’ve ever looked at a URL and noticed that it had something like this on the end:
?utmsource=SOMETHING&utmmedium=SOMETHINGELSE&utmcampaign=ANOTHERTHING
That’s what is known as a UTM string. It’s a string of code added to the end of a URL that allows Google Analytics to understand a number of things about how someone got to the page with that particular URL.
Here’s what this bit of code would be telling Google Analytics:
- utmsource=SOMETHING: This is the source of where the link was generated/shared and can be found in GA under Acquisition > Source/Medium. The word SOMETHING would be substituted with the appropriate source.
- utmmedium=SOMETHINGELSE: This is the medium over in which the link was shared/clicked and can be found in GA under Acquisition > Source/Medium also. The word SOMETHINGELSE would be substituted with the appropriate medium.
- utmcampaign=ANOTHERTHING: This is the name of the campaign in which this link was a part of and can be found in GA under Acquisition > Campaigns. The word ANOTHERTHING would be substituted with the campaign name.
There are other UTM parameters that can be added, but typically these are the primary ones.
Now, Google Analytics can often track inbound traffic from social networks without UTM tracking, this just gives you more intelligent control over the tracking so you can dig deeper.
If you want a more in-depth view of UTM tracking, Jeffrey Kranz has written acomplete guide to UTM codes over on the Buffer blog. I highly recommend it.
Google Analytics Dashboards

A Google Analytics Dashboard is a way to instantly see a snapshot of your site’s most important metrics. You can customize and create as many dashboards as you need.
Each dashboard is allowed up to 12 widgets, each containing a specific set of information that you want. So instead of having to dig through the various sections of Google Analytics and find the report you’re looking for, you can have them already populated in your dashboard for quick viewing.
Setting Up A Dashboard
Now, if you don’t want to take the time to set up your own custom dashboard, we’ll send you our one-click Google Analytics Dashboard Template. Just add your name and email below and we’ll send you the link right away!
For those of you who want a step-by-step walkthrough, here you go.

Click on the Dashboard tab on the right sidebar in Google Analytics. It will then drop some more items, one of which is +New Dashboard. Click that one.
You’ll be given the option to start with a Blank Canvas or a Starter Dashboard. Select the blank option and name your dashboard Social Media.
Once you’ve done that you will automatically be prompted to create a new widget. There are different types of widgets you can choose from that will display different sets of data in different ways.
Here are the widgets we’re going to create:
- Social Traffic Sessions
- Social Traffic Time on Site
- Social Traffic Pages per Visit
- Social Traffic Popular Content
- Social Traffic Campaigns and Conversions
- Social Traffic by Network (Pie Chart)
- Social Traffic Conversions by Network (Pie Chart)
- Social Traffic & Conversions (Table)
With these eight widgets you should be able to effectively measure how each social network is performing for your site.
Social Traffic Sessions
This widget will show you the total number of sessions (visits) that were brought in through social media. This could be from people clicking on shared links or links in your social profile bios.
To create this widget select Metric under the Standard list under Show the following metric search for and select Sessions.
Now you’ll want to create a filter that will ensure that the only sessions that are counted are sessions that came from a social network. To do this click Add a filter and use the following settings:
Only show / Dimension = Social Source Referral / Containing / Yes
It should look like this:

Social Traffic Time on Site
This widget allows you to see how long, on average, your visitors from social media are staying on your site.
Click +Add Widget and select the standard Metric type and under Show the following metric search for and select Avg. Session Duration.
The filter you’ll add is the same:
Only show / Dimension = Social Source Referral / Containing / Yes
It should look like this:

Social Traffic Pages per Visit
This metric will tell you how many pages, on average, a visitor views before leaving your site.
Since you’re probably getting the hang of this by now, here’s what this one should look like:

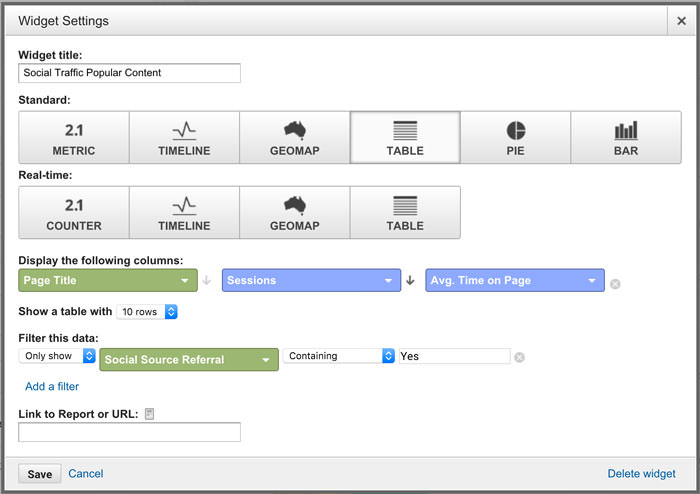
Social Traffic Popular Content
This widget will identify the blog posts that brought in the most social traffic and the average amount of time people spent on those posts.
For this widget you’ll select the standard Table type and under Display the following columns you’ll choose:
Page Title / Sessions / Avg. Time on Page
Select the option to Show a table with: 10 rows
You will then add the same filter as in previous examples.
Here’s what it will end up looking like:
Social Traffic Campaigns and Conversions
Now, remember when we talked about UTM tracking? This is where that comes into play.
If you are using UTM tracking in your links, this is where you can see how those campaigns are performing. This widget will display the top campaigns ordered by most sessions and give you the number of goal completions from each campaign.
For this widget you’ll select the standard Table type and under Display the following columns you’ll select:
Campaign / Sessions / Goal Completions
Select the option to Show a table with: 10 rows
You will be using two filters on this data set:
Don’t show / Campaign / Containing / (not set)
Only show / Social Source Referral / Containing / Yes
And here’s what the end product will look like:

Social Traffic by Network (Pie Chart)
This widget will create a pie chart so you can easily see what share of social traffic each network is sending to your site.
Select the standard Pie type and under Create a pie chart showing select Sessions. Under Grouped by select Social Network.
You can decide how many slices you want to show and whether or not you want it to be a donut chart. I always select the maximum number of slices (6) and I love donuts, so my pie charts are donuts too.
Your filter will be:
Only show / Social Source Referral / Containing / Yes
And the should look like this:

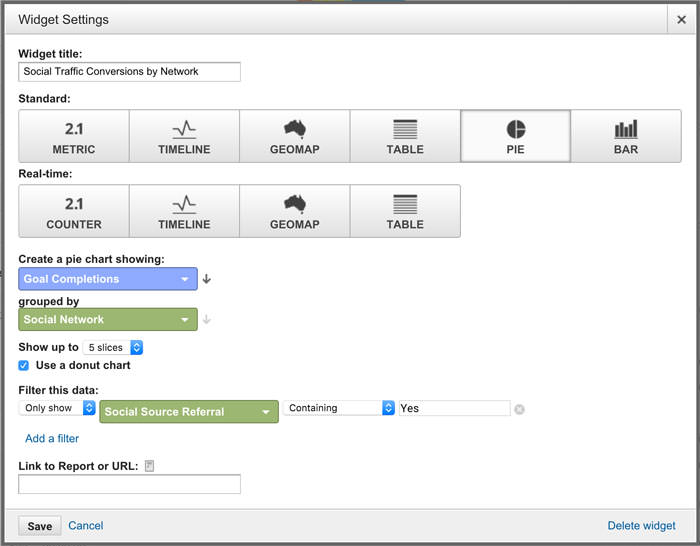
Social Traffic Conversions by Network (Pie Chart)
This pie chart will give you an at-a-glance look at what percentage of your total social traffic conversions are coming from each network.
For this widget select the Pie type and under Create a pie chart showing you will select Goal Completions grouped by Social Network.
Same filter as above.
Here’s what it should look like:
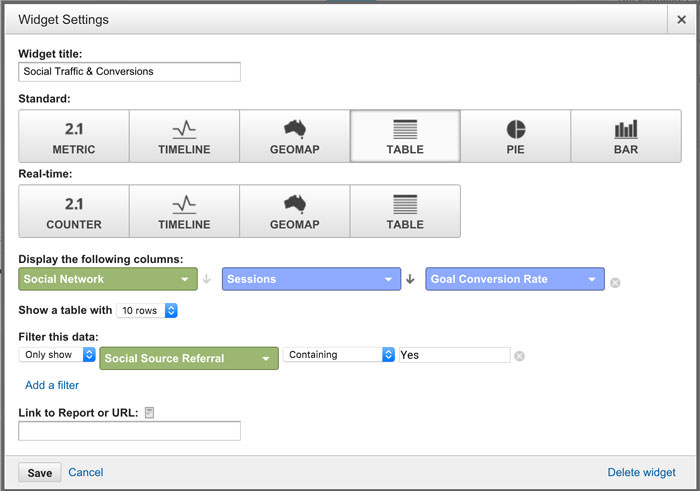
Social Traffic and Conversions (Table)
Finally, this last widget will show a table of which social networks are driving the most session and what the average conversion rate is. Essentially it’s a combination of the previous two pie charts.
For this widget select the standard table type with the following columns:
Social Network / Sessions / Goal Conversion Rate
Choose the number of rows you want to show (I chose 10) and then set a filter for:
Only show / Social Source Referral / Containing / Yes
It will look like this:
Bonus: Social Warfare Specific Widgets
For those of you who use Social Warfare on your blog you could also add some extra widgets to track specifically how the links being shared through the plugin are performing. This way, you can truly see how well Social Warfare is working for you.
Firstly, you’ll need to have Analytics Tracking set to On in your settings.
![]()
Notice how we’ve set the default campaign text is set to SocialWarfare. This will automatically be inserted in the UTM parameter for utmcampaign= so that Google Analytics can properly track the inbound traffic from those specific links.
This way, you can create any of the same widgets that you’re already monitoring but add an additional filter like this one:
Only show / Campaign / Containing / SocialWarfare
So if you want to know exactly how much of your social traffic Social Warfare is driving to your site, use this widget setup:

Or if you wanted to know which content was performing best as shared thorugh Social Warfare, you would use this setup:
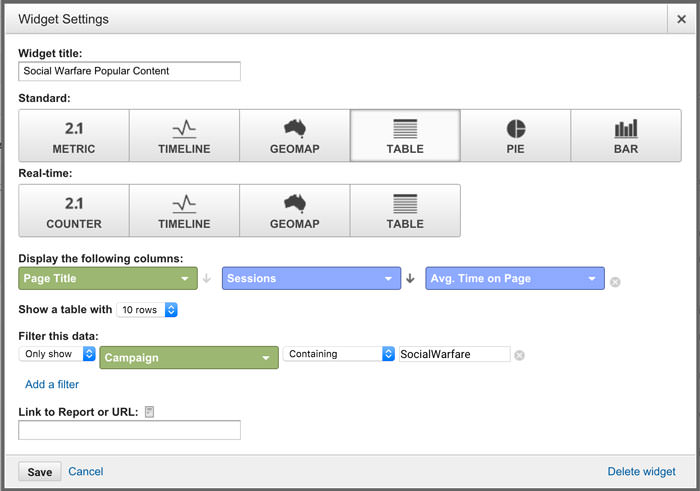
Or lastly, if you wanted to see which social networks were performing best by traffic sessions and conversion rate with Social Warfare shares, you could use this setup:
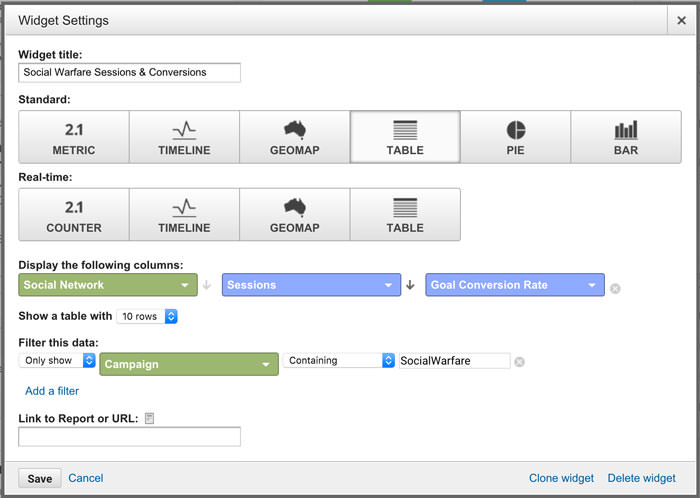
Again, all of this is packaged up for you in our Google Analytics Dashboard template which we’ll send to you right away when you subscribe below.
Do you know your top performing social networks? You do now –>CLICK TO TWEET
You have the data, now what?
Now that you’ve got your dashboard in place and all the data is right there before your eyes— what are you looking for?
Well if you’re like me then you want to be putting the right effort in the right places. So that means you’ll want to find where you’re getting the highest quality traffic— or in other words, which sources are converting the best.
The catch is you don’t want to only look at where your most traffic and conversions are coming from, you also want to look at the conversion rate. For me, I like to identify:
- Top 3 traffic sources by number of sessions
- Top 3 conversion sources by number of conversions
- Top 3 conversion sources by conversion rate
If you’ve set up your dashboard like we’ve gone through above, you can easily identify all of your most effective social networks and decide where you place your efforts moving forward.
But understand that this is still only part of the story. The data can only tell you so much about what’s working. The question of why it’s working is something you will need to constantly evaluate and test.
That’s why being able to customize how your content is being shared is so important. If you can understand what is working and why it’s working, you can tailor your shared content through Social Warfare so that when people share your content, you know it will be the most effective share possible and drive better results.
And that’s what we care about most— your results.
So let us know how it’s working! If you’ve found this post helpful, share your thoughts in the comments and share the post with your networks!
Other Articles

Intuit Is Sending Death Wish Coffee to the Super Bowl
Why Today’s Leaders Need to Get to Know #BigData
